When trying to find data regarding secondary education, we opted to use data from the 2017-2018 school year. We wanted data that was available, and, due to the COVID-19 pandemic, data from recent school years was not available. In addition, we noticed the adverse effects of the pandemic on secondary education, so we opted to use the latest possible data that happened prior to the COVID-19 pandemic. As the schooling situation goes back to normal, the data recorded will start to look like the data recorded before the COVID-19 pandemic, so our observations will begin to fall in line with the current schooling situation. For the people who are looking to use our research to observe the effects of the COVID-19 pandemic should use our research with caution as these observations and datasets were recorded prior to the pandemic.
University of California

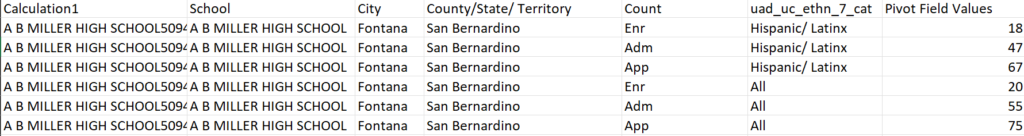
One of our primary data sources was the “Admissions by sources” dataset by the University of California admissions department. We used the Fall 2018 term as that is the term that high school fourth year students during the 2017-2018 school year would apply to. The dataset includes divisions in regards to ethnicities but we opted to use the data points for that includes all ethnicities. We opted to only include public schools in our visualizations as we wanted to delve into governmental support for schools. The dataset includes three different attributes:
- Applied: The number of people who applied to at least one University of California campus.
- Admitted: The number of people who are admitted to at least one University of California campus.
- Enrolled: The number of people who enrolled in a University of California campus.
From these different attributes, we made a new column “Acceptance rate” which is calculated by dividing the number of people who got admitted by the number of people who applied.
Because of the way the data is given, we have to think about different contexts for each datapoint. For example, if a student applied to all University of California campuses but only got into one campus, they are counted as being “admitted” despite being rejected by other campuses. On the other hand, if a student applied to and got admitted to all campuses, they are only counted as being “admitted” once. Because of these different contexts, we should not make any inferences about a specific University of California campus, but rather the whole system together.
We should also note that the University of California has a statewide guarantee to students, promising admission to at least one University of California campus for the top 9% of students in California. They calculate whether or not a student is in the top 9% in California through the use of a formula called the “Statewide Index,” factoring in “A-G course totals” and “UC GPA.” The percentage of students who are in the top 9% per school is not included in the dataset, so inferences about how well students are doing in relation to other students in California should not be made.
As for handling the data, when we downloaded the CSV file, the CSV file was misformatted, having the data for one school split into multiple rows. We were forced to merge the dataset using Pandas, merging the rows together for each school.
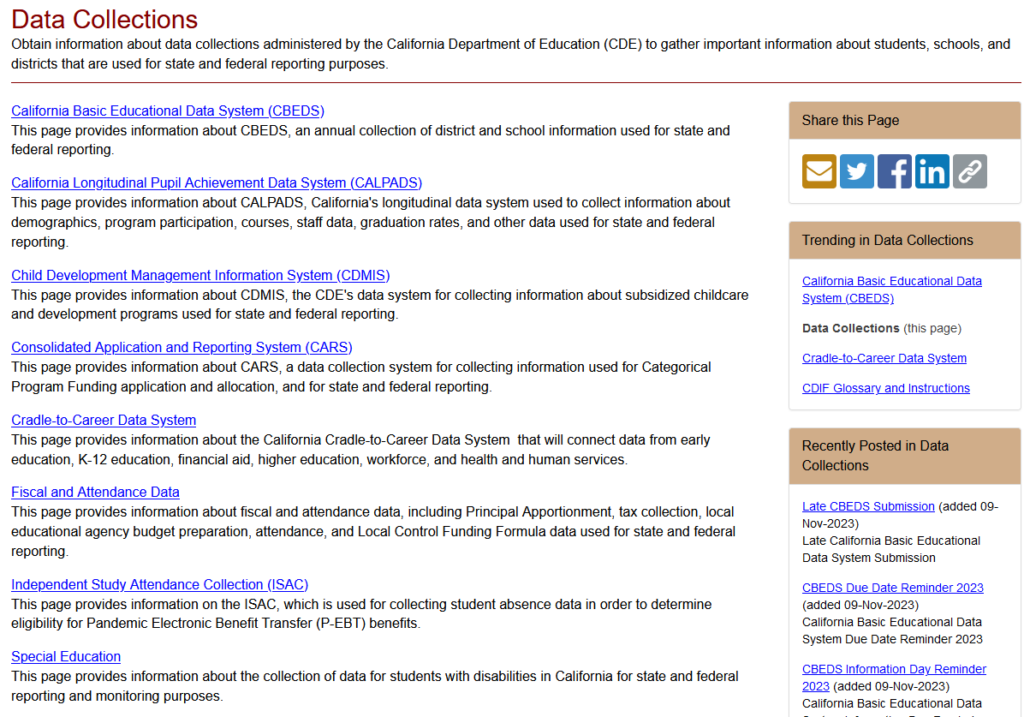
California Department of Education
In addition to the dataset provided by the University of California, we also used datasets from the California Department of Education. From this source, we compiled and merged several datasets, using the following attributes for each public school in California:
- Socioeconomically Disadvantaged Percentage: Percentage of students who meet the following criteria:
- neither of the student’s parents has received a high school diploma
- the student is eligible for or participating in the Free Meal program or Reduced-Price Meal program
- the student is eligible for or participating in the Title I Part C Migrant program,
- the student was considered Homeless
- the student was Foster Program Eligible
- the student was Directly Certified
- the student was enrolled in a Juvenile Course School
- the student is eligible as Tribal Foster Youth
- ELA Std Met %: Percentage of students who met or exceeded the English and Language Arts standards
- Math Std Met % Percentage of students who met or exceeded the Mathematics standards
- UC-CSU Req Met %: Percentage of students who met the A-G course requirements
- Graduation %: Percentage of students who graduated high school
- Adjusted Cohort Graduation Rate: Percentage of students who graduate high school within 4 years of starting 9th grade
- College going rate: Percentage of students who enrolled in a postsecondary institution
- Percent (%) Eligible FRPM (K-12): Percentage of students who are eligible for free or reduced lunch
- T1_minsal: The minimum salary for a teacher
The dataset as a whole had it’s quirks. Some of the datasets we used included both primary and secondary schools so we filtered out and only used data about secondary schools. The data provided was limited, so we needed to switch topics. A lot of the data was split into several datasets, making it inaccessible for people who wanted to work with all of the data. The datasets have a unique identifier for each school, making it easier to merge all data, but upon close inspection, some of the unique identifiers were actually not unique, so we had to merge the dataset by combining other identifiers.
When handling this dataset, people should consider the broader context where the data was collected. Some schools have better stats than others, having higher graduation rates and having a higher rate of people pursuing post secondary enrollment, but it is unjust if we just consider attributes that are purely educational, we must also consider socioeconomic factors. The datasets provided by the California Department of Education contain both educational and socioeconomic data surrounding these schools so it is a great resource to use.
US News
Finally, we used data from US News, looking at the graduation rates of the top 50 schools in California. Data from the 2017-2018 school year was unavailable, so we opted for the data that was available to the website, and that would be data from the 2022-2023 school year. We felt that while the school years are different, using this data would be reasonable since the difference in graduation rate for these top schools during the 2017-2018 school year would be comparable to the graduation rate during the 2022-2023 school year. The rankings done by the US News data is subjective, so people should not treat these rankings as fact, but we felt that looking at the top 50 high schools in California according to the US News rankings would be a good way to look at how elite schools compare to California as a whole.
As for our challenges with this data, we only had one challenge. Data from the website was not downloadable, so we had to manually input the data to a spreadsheet.