Household Circumstances and College Attendance
Many view a high school’s success through the straightforward metric of its ability to propel students toward college. If the ultimate goal is college attendance, the school’s primary focus should center on cultivating as many college-ready students as possible. Institutions falling short of this benchmark often face criticism, labeled as “lower-performance” entities by both media and communities. While it is essential for schools to allocate resources to connect students with higher education, we must acknowledge that not all schools can match the number of students sent to college in comparison to their counterparts. Various variables, particularly household income levels, can significantly impact a high school’s capacity to produce college-bound individuals.
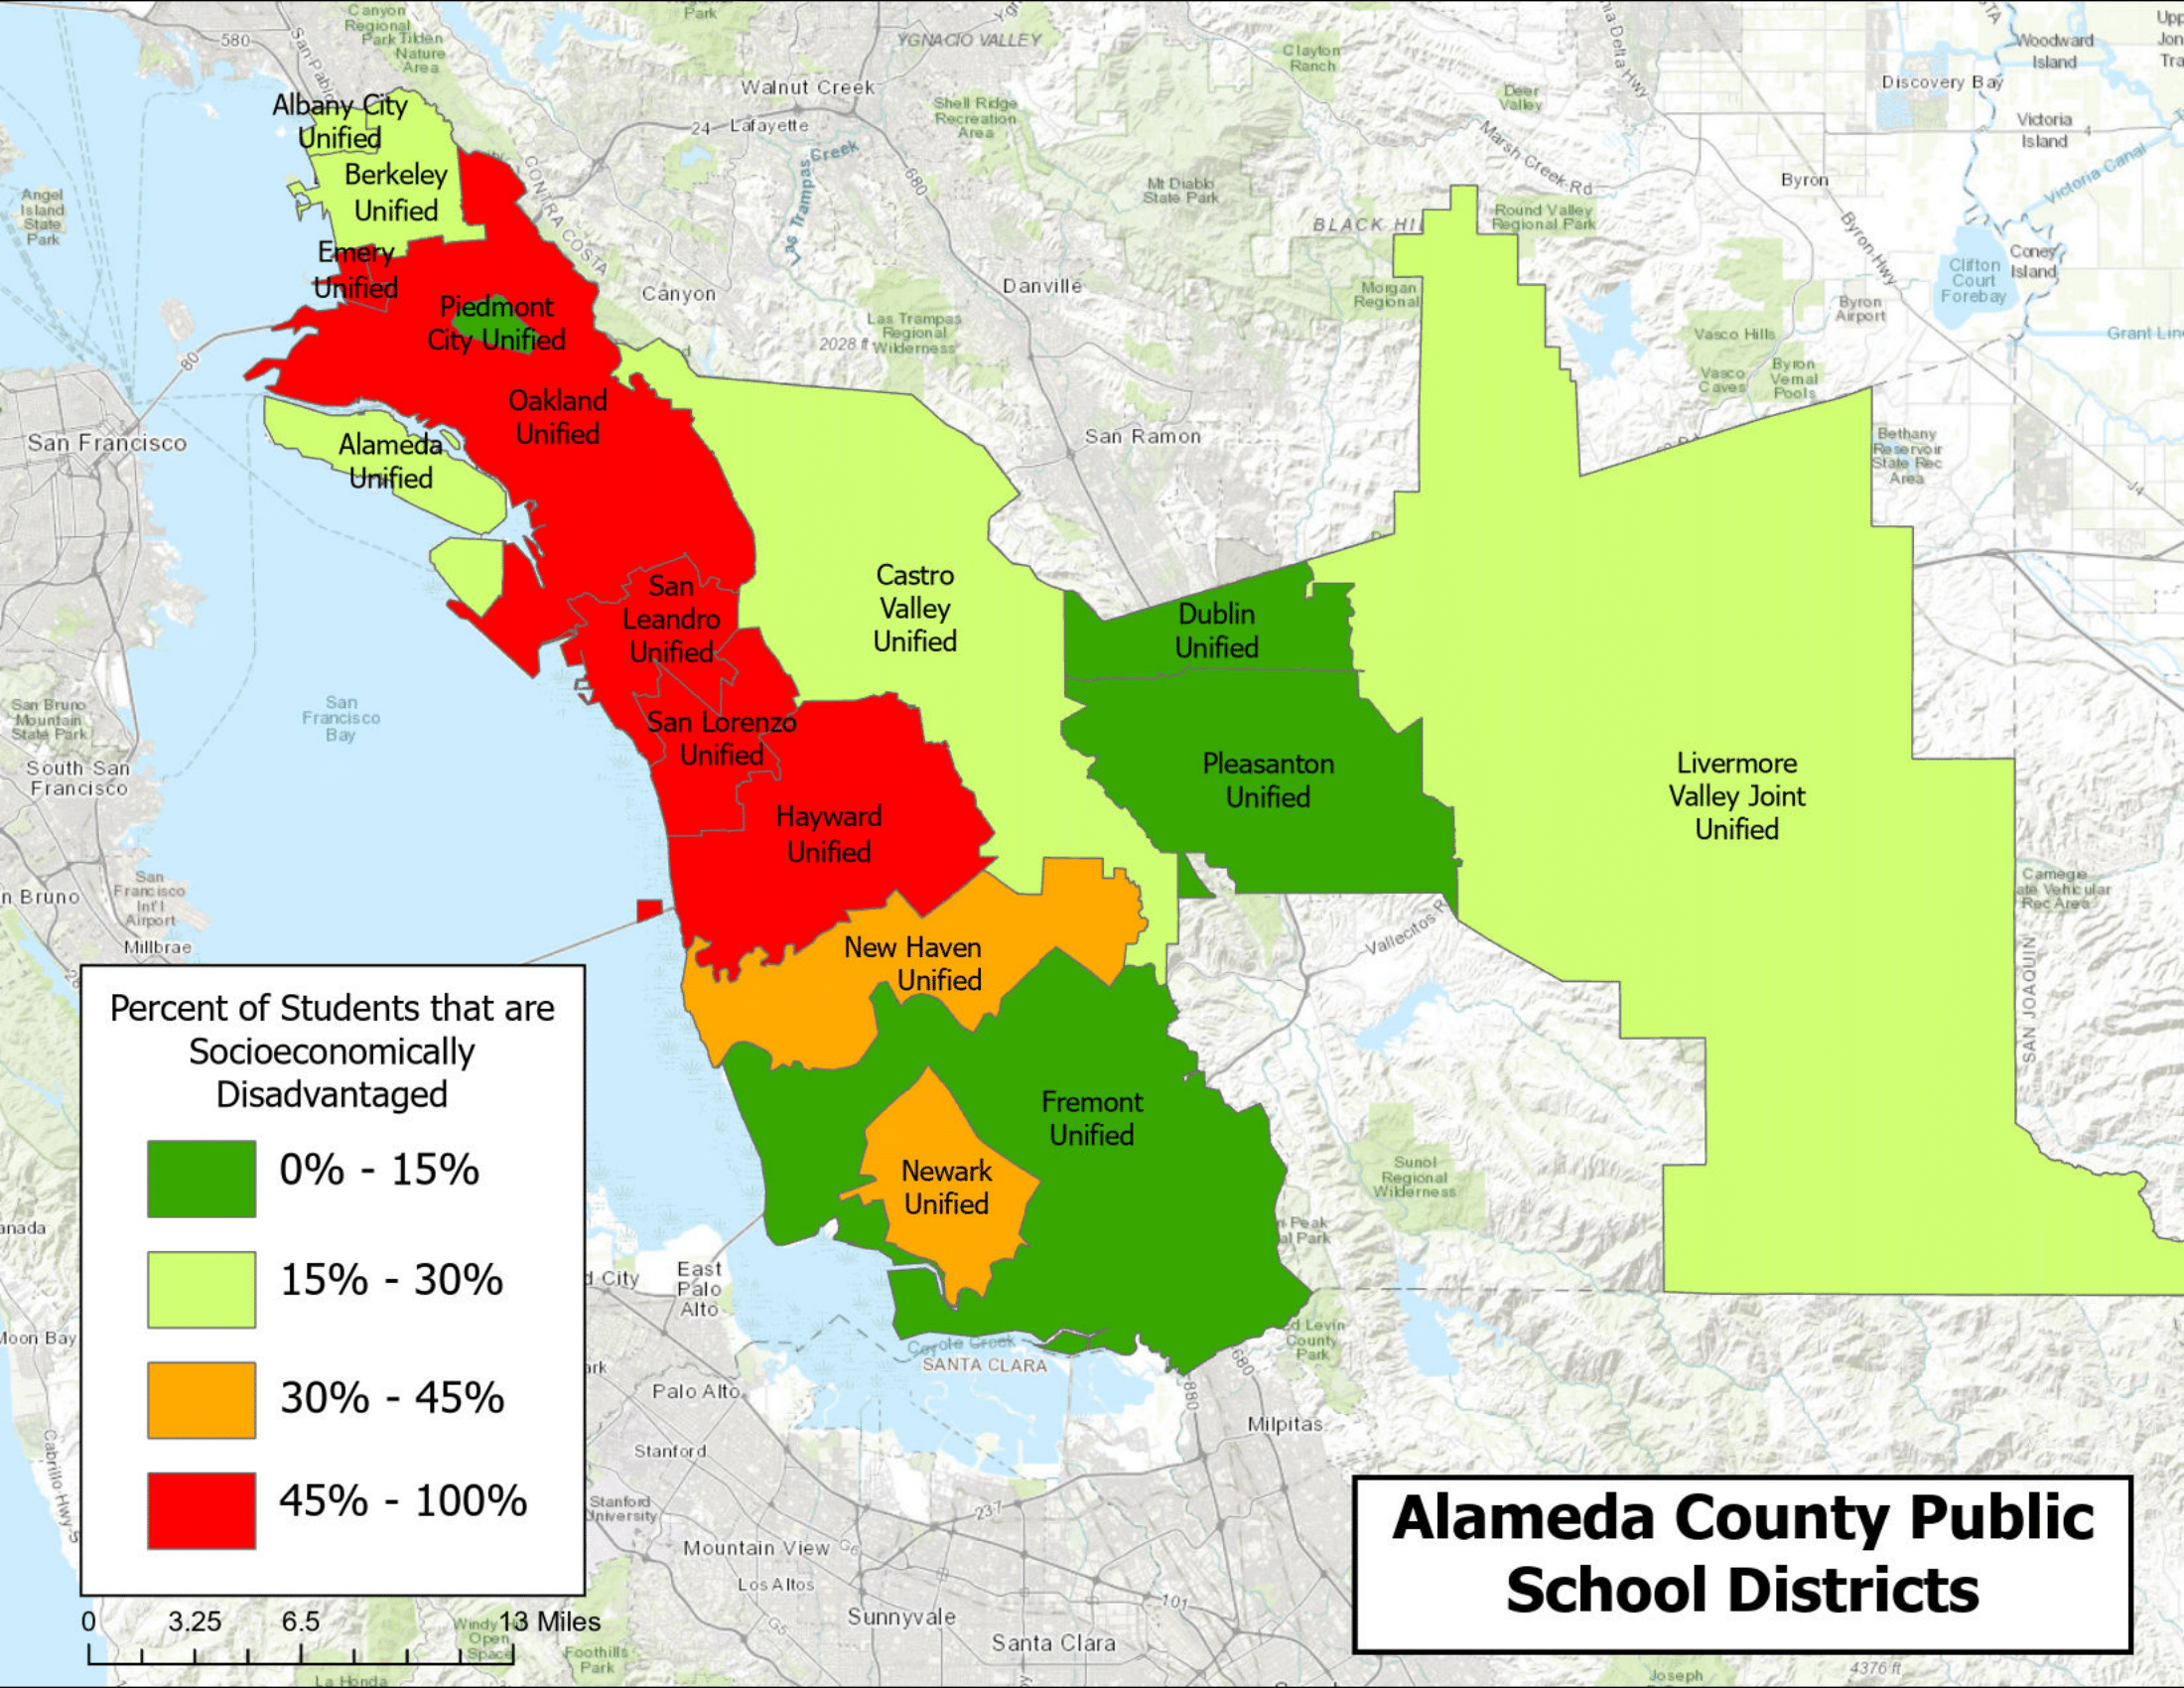
Extensive research reveals a strong correlation between a student’s household income and the likelihood of attending college. Schools with a less affluent student population tend to have students with limited access to resources that adequately prepare them for higher education. To illustrate, consider the case of Alameda County, a region in Northern California with a diverse range of socioeconomic conditions. Map 1 depicts the percentage of students classified as “socioeconomically disadvantaged (SED)” in each respective district. SED status is conferred upon those meeting at least one of several criteria: eligibility for the free or reduced-price meal program, participation in the Title I Part C Migrant program, enrollment in a Foster Program, designation as a Tribal Foster Youth, homelessness, enrollment in a Juvenile Course School, or having neither parent with a high school diploma.
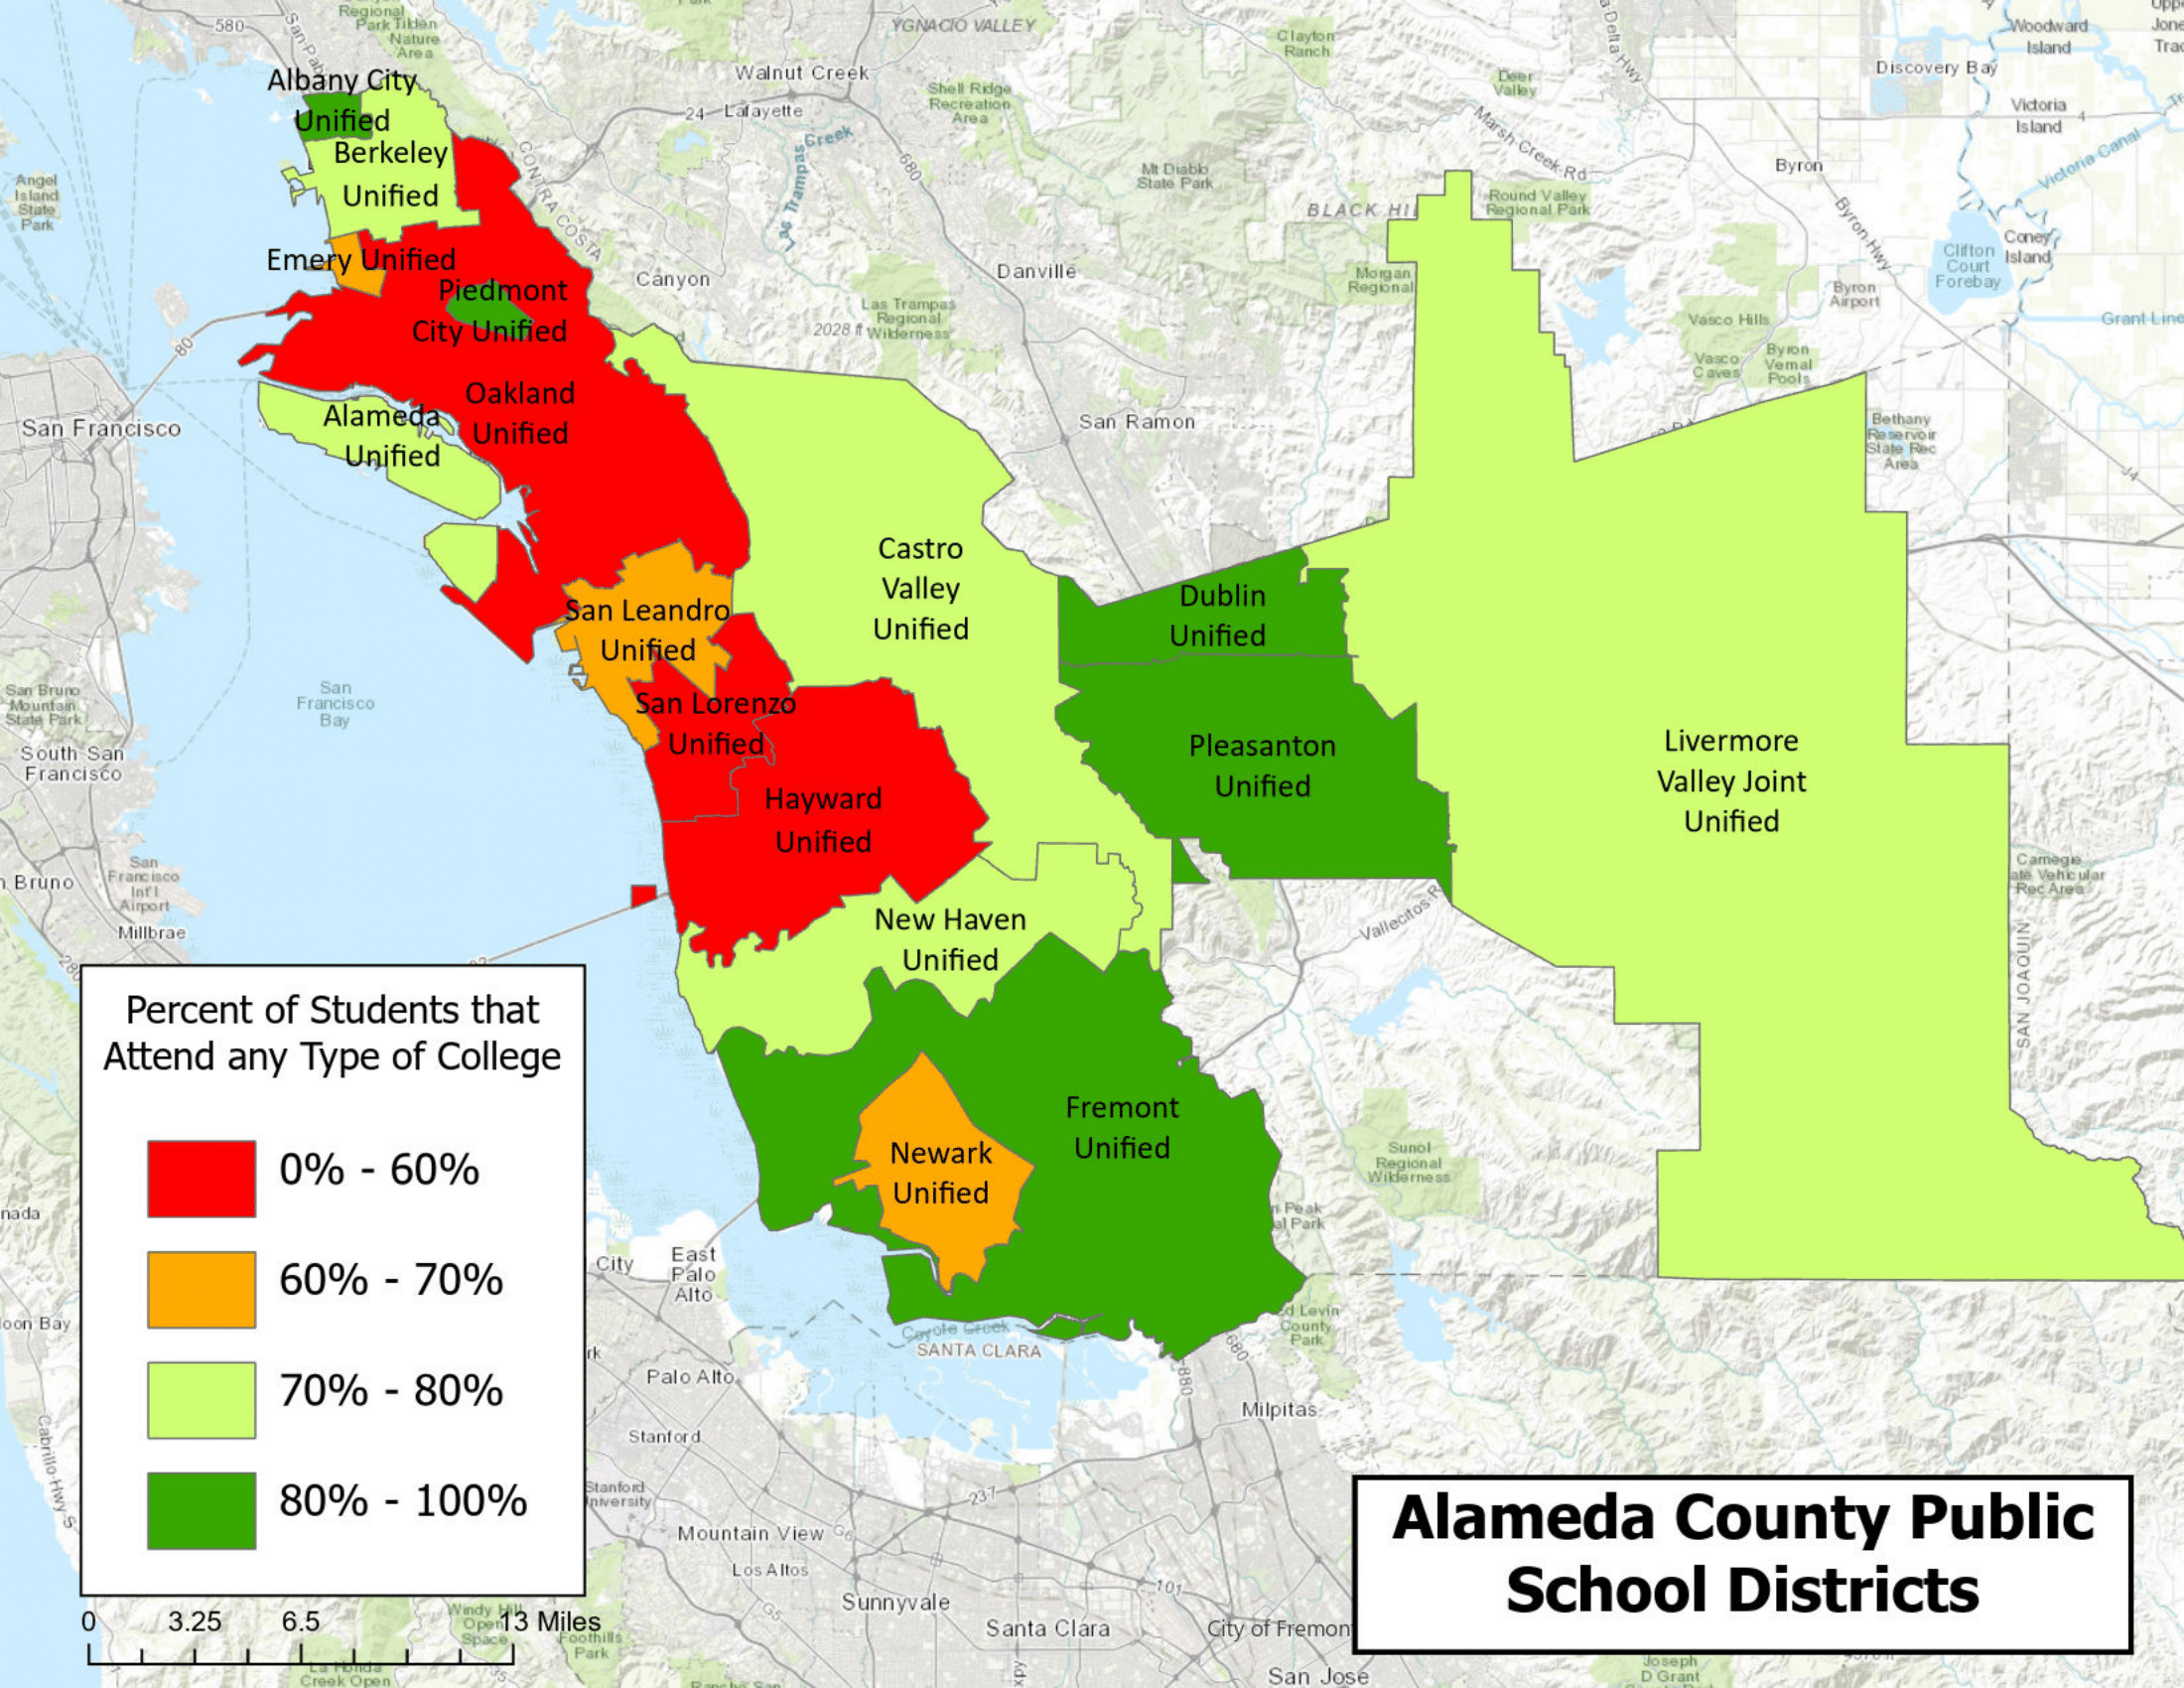
As evident on the map, a noticeable correlation exists between a school district’s percentage of SED students and the percentage of students attending college. In districts marked in red and orange, students are less likely to have access to educational and extracurricular opportunities, rendering the path to college more arduous and less likely compared to their counterparts in green school districts.
A school’s SED is not the sole determinant influencing its capacity to send students to colleges; geographic location can also contribute to variances in applicant numbers. Examining the graphic below reveals a correlation between a county’s level of urbanization and the number of students applying to UC schools. While a portion of this discrepancy is attributed to the population density of residents in these less-rural counties, studies indicate that proximity to universities plays a pivotal role in a student’s decision to apply.

For instance, a student residing in Riverside County is significantly more inclined to apply to UCR than a student in Ventura County. However, a student in Ventura County is more likely to apply to any UC institution compared to a student in Butte County, owing to Ventura’s proximity to a greater number of schools. If a school finds itself in a geographic region lacking nearby institutions, it adds another factor diminishing its ability to send students to college.
This only scratches the surface of the role that race plays in college admissions. Schools with higher percentages of disadvantaged racial groups often encounter systemic barriers that hinder their students from pursuing higher education (Bleemer). Substantial research demonstrates that certain minority groups confront significant challenges and disadvantages at every stage of the college admissions process — from accessing resources and completing applications to being considered for admission (Santos). The influence of race on college attendance rates is an additional factor underscoring why it should not serve as the sole defining metric for a successful secondary school.
Considering the amount of funding a school receives is crucial when evaluating school performance metrics. Increased funding provides schools with greater access to resources and programs that can positively impact students’ academic performance. One funding aspect with a direct influence on performance is illustrated in the graphic below. Research has identified a slight correlation between teacher compensation levels and students’ standardized test performance, revealing a positive relationship between the two variables. In California’s public school system, funding is predominantly derived from neighborhood property taxes (Wodtke). Consequently, schools with limited funding face challenges in allocating adequate funds to teacher salaries, potentially resulting in fewer highly qualified teachers choosing to work in these schools (Johnson).

Evaluating school performance metrics necessitates careful consideration of funding levels, as increased financial support grants schools access to resources and programs that can positively influence students’ academic performance. The graphic above underscores one funding aspect directly impacting performance: research indicates a slight correlation between teacher compensation levels and students’ standardized test performance, highlighting a positive relationship between these variables. In California’s public school system, funding primarily originates from neighborhood property taxes, posing challenges for schools with limited resources to allocate sufficient funds to teacher salaries. This limitation may result in fewer highly qualified teachers opting to work in these schools.
Criteria Improvements for School Performance
The presented data strongly emphasizes the need for a comprehensive approach when measuring success in schools, extending beyond simplistic criteria such as college attendance and test scores. A more holistic perspective that considers socioeconomic factors is essential. As an illustration, examining the USNews ranking of California high schools provides valuable insights. USNews, renowned for its annual college rankings, assigns a ranking to each California high school yearly. Their transparent methodology sheds light on the factors they deem significant in determining a school’s ranking (Morse).
- College Readiness (30%)
- College Curriculum Breadth (10%)
- State Assessment Proficiency (20%)
- State Academic Performance (20%)
- Underserved Student Performance (10%)
- Graduation Rate (10%)

While this criteria represents a positive step forward, the methodology arguably requires further refinement and may be overlooking certain variables. As indicated in the graphic, the test scores of the Top 50 California Public Schools are nearly X points higher than the state’s median. The weight allocated to a school’s college-related metrics (40%) and state test performance (40%), in comparison to accounting for socioeconomic factors (20%), contributes to the perception that schools unable to achieve outstanding test scores cannot be labeled as successful. Furthermore, there is extensive research suggesting that the emphasis on a school’s reputation based on state test scores may incentivize schools to manipulate results to present a more favorable image (Rogers). With such a significant emphasis on traditional metrics, the average school faces challenges in obtaining a favorable ranking. This approach can adversely impact the school’s reputation, perpetuating the notion that schools with lower test scores are to be deemed failures.
The data presented underscores the importance of adopting a comprehensive approach to measuring success in schools, moving beyond simplistic criteria like college attendance and test scores. A more holistic perspective that considers socioeconomic factors is indispensable. For example, exploring the USNews ranking of California high schools offers valuable insights. USNews, renowned for its annual college rankings, annually assigns rankings to California high schools. Their transparent methodology provides clarity on the factors they consider significant in determining a school’s ranking.
The graphic below provides a potential glimpse into what an improved performance measurement criteria might resemble. The Chaffey Joint Union High School District, overseeing eight public high schools scattered throughout San Bernardino County in Southern California, has established a reputation, with the four northern schools (Los Osos, Rancho, Alta Loma, and Etiwanda) perceived as having higher academic performance grades compared to their southern counterparts (Colony, Chaffey, Ontario, Montclair). Upon examination of the visualization, it becomes evident that without accounting for the factor of SED% (socioeconomically disadvantaged percentage), this perception holds.

However, when factoring in the percentage of students who are socioeconomically disadvantaged, the traditional hierarchy of schools is disrupted. Three out of the top four schools emerge from the “southern” schools. This data visualization effectively demonstrates how incorporating variables that account for socioeconomic factors can contribute to a more equitable measure of what success looks like.